Settlement in California
Indigenous enter at the bottom of the labor market
Indigenous participation in California agriculture expands
Concentrations of indigenous farmworkers in different parts of California
Hometown networks help explain settlement patterns
Temporary migration elsewhere within the United States
Indigenous enter at the bottom of the labor market
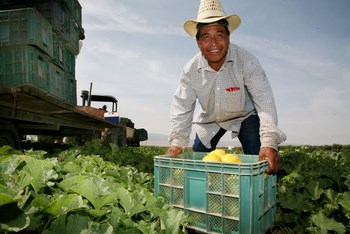 The arduous work of harvesting field crops provides entry-level jobs for Mexican indigenous migrants. Here a Mixtec farm worker from Oaxaca picks Korean melons, a specialty crop grown grown near Taft, in the vicinity of Bakersfield. Photo copyright David Bacon
Mexican indigenous farmworkers are the most recent of many groups that have occupied the bottom rung of the farm labor market in California. The U.S. food system has long been dependent on the influx of an ever-changing, newly-arrived group of workers that sets the wages and working conditions at the entry level in the farm labor market. The indigenous workers are already dominant in many of the most arduous farm labor tasks (e.g. picking raisin grapes and strawberries). And, the entry-level conditions maintained in these sectors are used to control (and limit) labor costs of the approximately 700,000-strong California farm labor force.
Indigenous participation in California agriculture expands
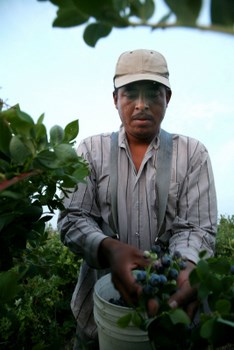 As demand for blueberries has grown, so had the need for workers to pick the fruit, creating another entry-level job for indigenous migrants. Here a Mixtec from Oaxaca picks blueberries in Lamont, near Bakersfield. Photo copyright David Bacon
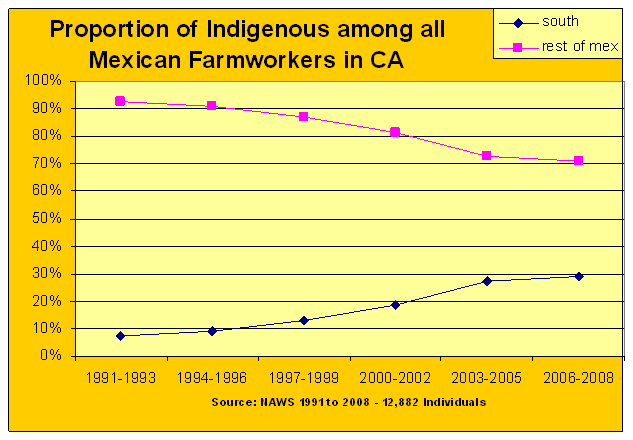
Despite the fact that the indigenous face a multiple obstacles, such as limited financial resources, lack of proficiency in Spanish, and inhabiting remote areas of Mexico, they have nevertheless developed strategies in recent decades to cross the international border into the United States. In fact, people from the heavily indigenous swath of Mexico south of Mexico City, an area that encompasses the states of Oaxaca, Guerrero and Puebla, have recently become as actively involved in cross-border migration as are the ‘mestizos’ from the traditional sending regions of west-central Mexico. This expanded migration is clearly visible in the increase of indigenous among all Mexican farmworkers in California.
To draw comparisons between the indigenous and mestizos (or non-indigenous) of Mexico, we use the U.S. Department of Labor’s National Agricultural Workers Survey (NAWS) data. Since most of the Mexicans from southern Mexico are indigenous and the vast majority of those from the rest of Mexico are mestizos, we make the southern Mexicans our proxy (or stand-in) for the indigenous population. We admit that this is a far from perfect substitute for a direct comparison, but since none exists in any data source, we use this comparison in the NAWS between southerners and those from the rest of Mexico as the best replacement. As you can see in the chart below, there has been an enormous change in recent decades. The proportion of southerners grew by four times in less than twenty years, from 7% in the 1991-1993 period, to 29% in the 2006-2008 period. There has unquestionably been a surge of indigenous Mexicans into California agriculture since the early 1990s.
Concentrations of indigenous farmworkers in different parts of California
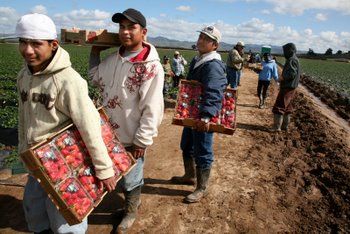 Over the last two decades the dramatic expansion of strawberry production along California's central coast has drawn many indigenous farm workers. Here, in a field near Santa Maria, Mixtec and Zapotec workers from Oaxaca and Guerrero wait to hand in the strawberries they've picked. Photo copyright David Bacon
From the population estimates that we made using our count of hometown networks, we are able to show how the population of indigenous farmworkers is distributed across the various agricultural regions of California. Then, by turning to the National Agricultural Worker Survey (NAWS) , we are able to confirm our findings. When we group our estimates into larger regional units, we discover that the Central Coast area from Oxnard to Watsonville has almost half (46%) of all indigenous farmworkers, the Central Valley has about a third, San Diego has 16% and the North Coast just 5%. Despite the fact that the Central Valley accounts for most of California’s agriculture, it appears that a plurality of the indigenous work force labors along the Central Coast (see the chart below).
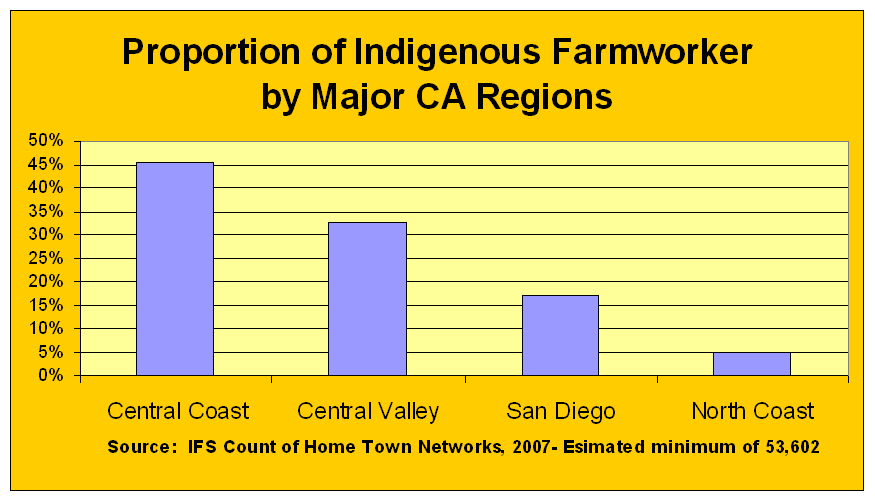
The NAWS again corroborates that the proportion of southerners is very high, both along the Central Coast and in the Central Valley. The NAWS, however, does not give any population estimate.
Population estimates for 12 Agricultural Regions
Hometown networks help explain settlement patterns
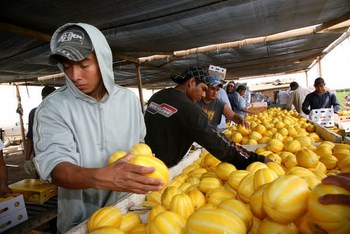 Farm workers wash, sort and box Korean melons in a packing shed near Bakersfield. Almost everyone in this crew lives in Taft and comes from the Oaxacan town of Candelaria de la Unión, in the municipio of San Pablo Tijaltepec. Photo copyright David Bacon
To fully understand the different types of settlement patterns of indigenous communities, one must recognize that there is an enormous variation among them. In our study we examined nine quite distinct communities, or hometown networks, so that we could demonstrate this diversity and assist those who work with indigenous farmworkers come to grips with the variety.
In addition to age of the network, which we define as the average time in the U.S. of its members, there are several other important features that characterize the people in the different the networks. We think the best way to understand these key features is to read through short descriptions of the nine communities that we came to know the best.
Temporary migration elsewhere within the United States
Our information about temporary migration of the indigenous comes entirely from our Indigenous Farmworker Study (IFS). We need to warn the reader that our information on this topic is incomplete. Still, we can share certain findings that suggest that temporary migration to do farm work is still a significant activity among indigenous farmworkers.
The IFS allows us to report the percent of time that California-based farmworkers spend outside the state of California while in the United States. The 400 indigenous farmworkers in our sample, as a group, spent 7% of their time outside the state. For men the rate was 9%, and for women it was only 2%. Of course, we are reporting an average. This means that some of these 400 workers spent considerable time outside the state and others never left at all. We found that, for those in our survey, Oregon, Florida and Washington are the most frequented migration destinations. We also asked a group of representatives from 67 home town networks about temporary migration among the California-based people from their home town. Of the 67 towns, about two-thirds reported having temporary work migration. About a third of the destinations are in Oregon, a third in Washington, and a third elsewhere in California. At least for these 67 communities, there are still significant numbers of migrants leaving California for temporary migration destinations every year. And, significant numbers of them take their families with them.